Trade promotion · Cashflow · Built by operators

Trade Promotion
and Cashflow
Management,
built with operators.

Most TPM and cashflow software was built by software vendors trying to understand FMCG. Strattie is the opposite — decades of brand and retail operating experience, codified into AI-powered software.

What you get

One system.
Six modules.
Live in four weeks.
Zero spreadsheets.

app.strattie.com / optix / dashboard
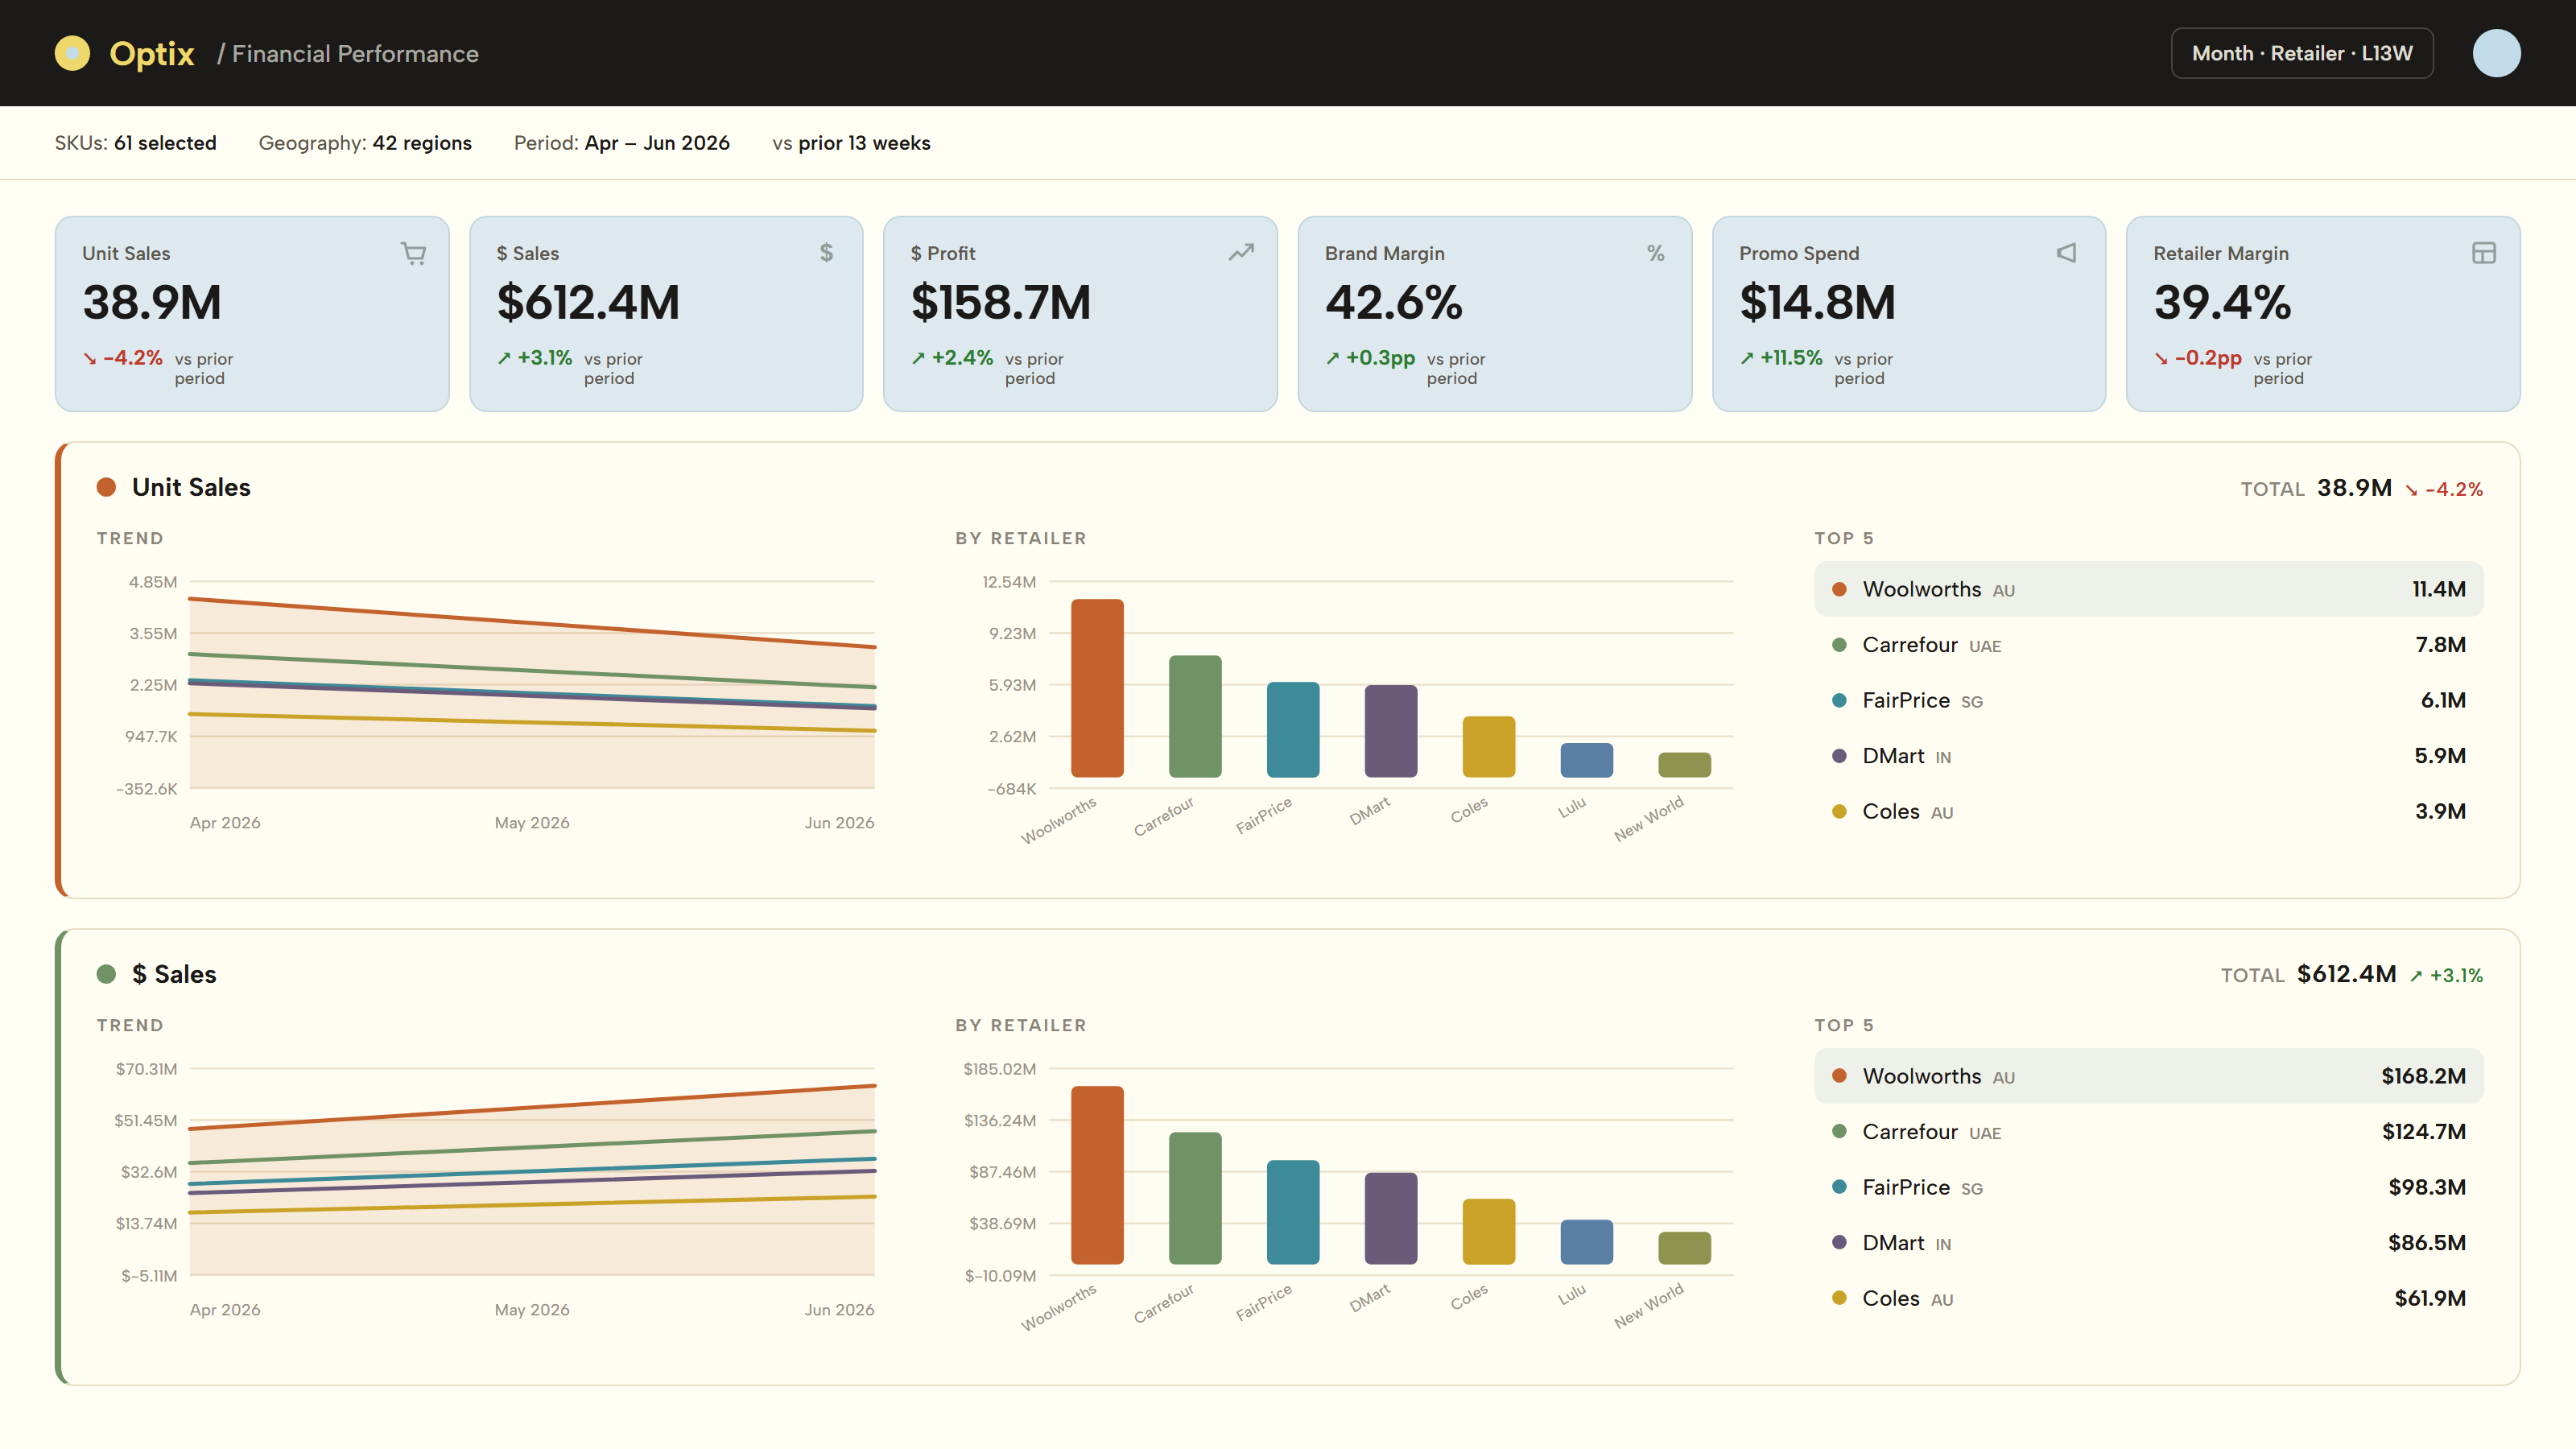
Optix dashboard — six KPI cards and trend chart
Trusted by FMCG operators across Australia & New Zealand
The Promonition loop

Plan, execute, validate,
report — and forecast the cash.

Legacy TPM tools sell you pieces. Strattie sells the whole planning cycle. Six modules, one audit trail, one canonical data layer underneath.

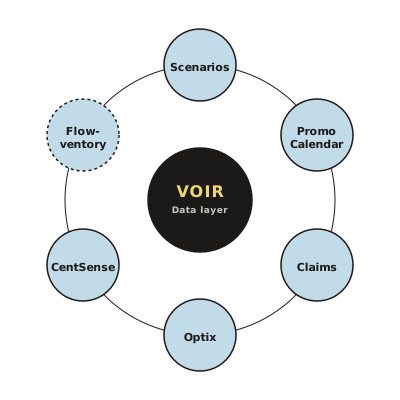
Promonition loop — Voir data layer at the centre with Scenarios, Promo Calendar, Claims, Optix, CentSense and Flowventory orbiting
VoirIs the data clean enough to trust any of this?Data layer
Promonition
ScenariosWhat should we do?Live
Promo CalendarWhat did we actually do?Live
ClaimsAre we paying the right amount?Coming soon
OptixHow is it all performing?Live
CentSenseWhen does the money actually move?Coming soon
FlowventoryWill we have the stock to back the plan?Roadmap
Tour Promonition
Recover money you're currently losing
3–8%
Of trade spend walks out the door

Claims gets it back.

Industry estimate
Trade spend overpayment
FMCG brands · AU/NZ
Claims

Stop overpaying retailers by default.

For a brand spending $10M a year, that's $300K–$800K recoverable. Claims auto-calculates what each retailer should be invoicing, flags the gaps, and reconciles 5,000 claim rows in under five minutes.

Claim rows reconciled5,000 / <5 min
Invalid claim identification80%
Manual validation per period2–4h → <15m
See Claims
Kill the Monday morning Excel ritual

Stop running trade promo on spreadsheets.

Every planner we've spoken to spends 45 minutes in Excel before anyone can answer “how did we do last month?” Strattie collapses scenario planning, scheduling, claims, and cashflow into one system with one dashboard.

45min
Monday morning ExcelBefore anyone can answer “how did we do last month?”
6
KPIs, zero consolidationUnit Sales, $ Sales, $ Profit, Brand Margin, Promo Spend, Retailer Margin
<3s
Dashboard load52 weeks × 4 retailers

Directors and Managers land here on login.

Optix · Financial Performance
Six KPIs · versus prior period
Optix · Financial Performance
Optix dashboard — six KPI cards, trend chart, hierarchical filters
No six-month data project
Day one.
Not month six.

Most TPM rollouts stall on a four-to-six-month data integration project. Voir is the canonical data layer, built into the platform — POS scan data, retailer portals, Xero, MYOB, bank feeds, all sanitised and ready to consume in weeks.

Industry norm
4–6 months
Strattie
Weeks
Canonical layer
Built in